UAL’s June 2018 consolidated traffic (revenue passenger miles) increased 7.2 percent and consolidated capacity (available seat miles) increased 4.2 percent versus June 2017. UAL’s June 2018 consolidated load factor increased 2.5 points compared to June 2017.
June Highlights
- As part of a previously announced $8 million commitment, announced a total of $3 million in grants to our hub communities in Houston; Washington, DC; and Denver – $1 million to the Houston Food Bank in support of its School Market program, $1 million to the Year Up National Capital Region, and $1 million to Warren Village, a Denver nonprofit organization.
- Completed the best on-time departure rate of any summer month and the fewest controllable cancellations of any June in United history.
- Introduced the new United Explorer Card which offers additional benefits, travel credits and discounts.
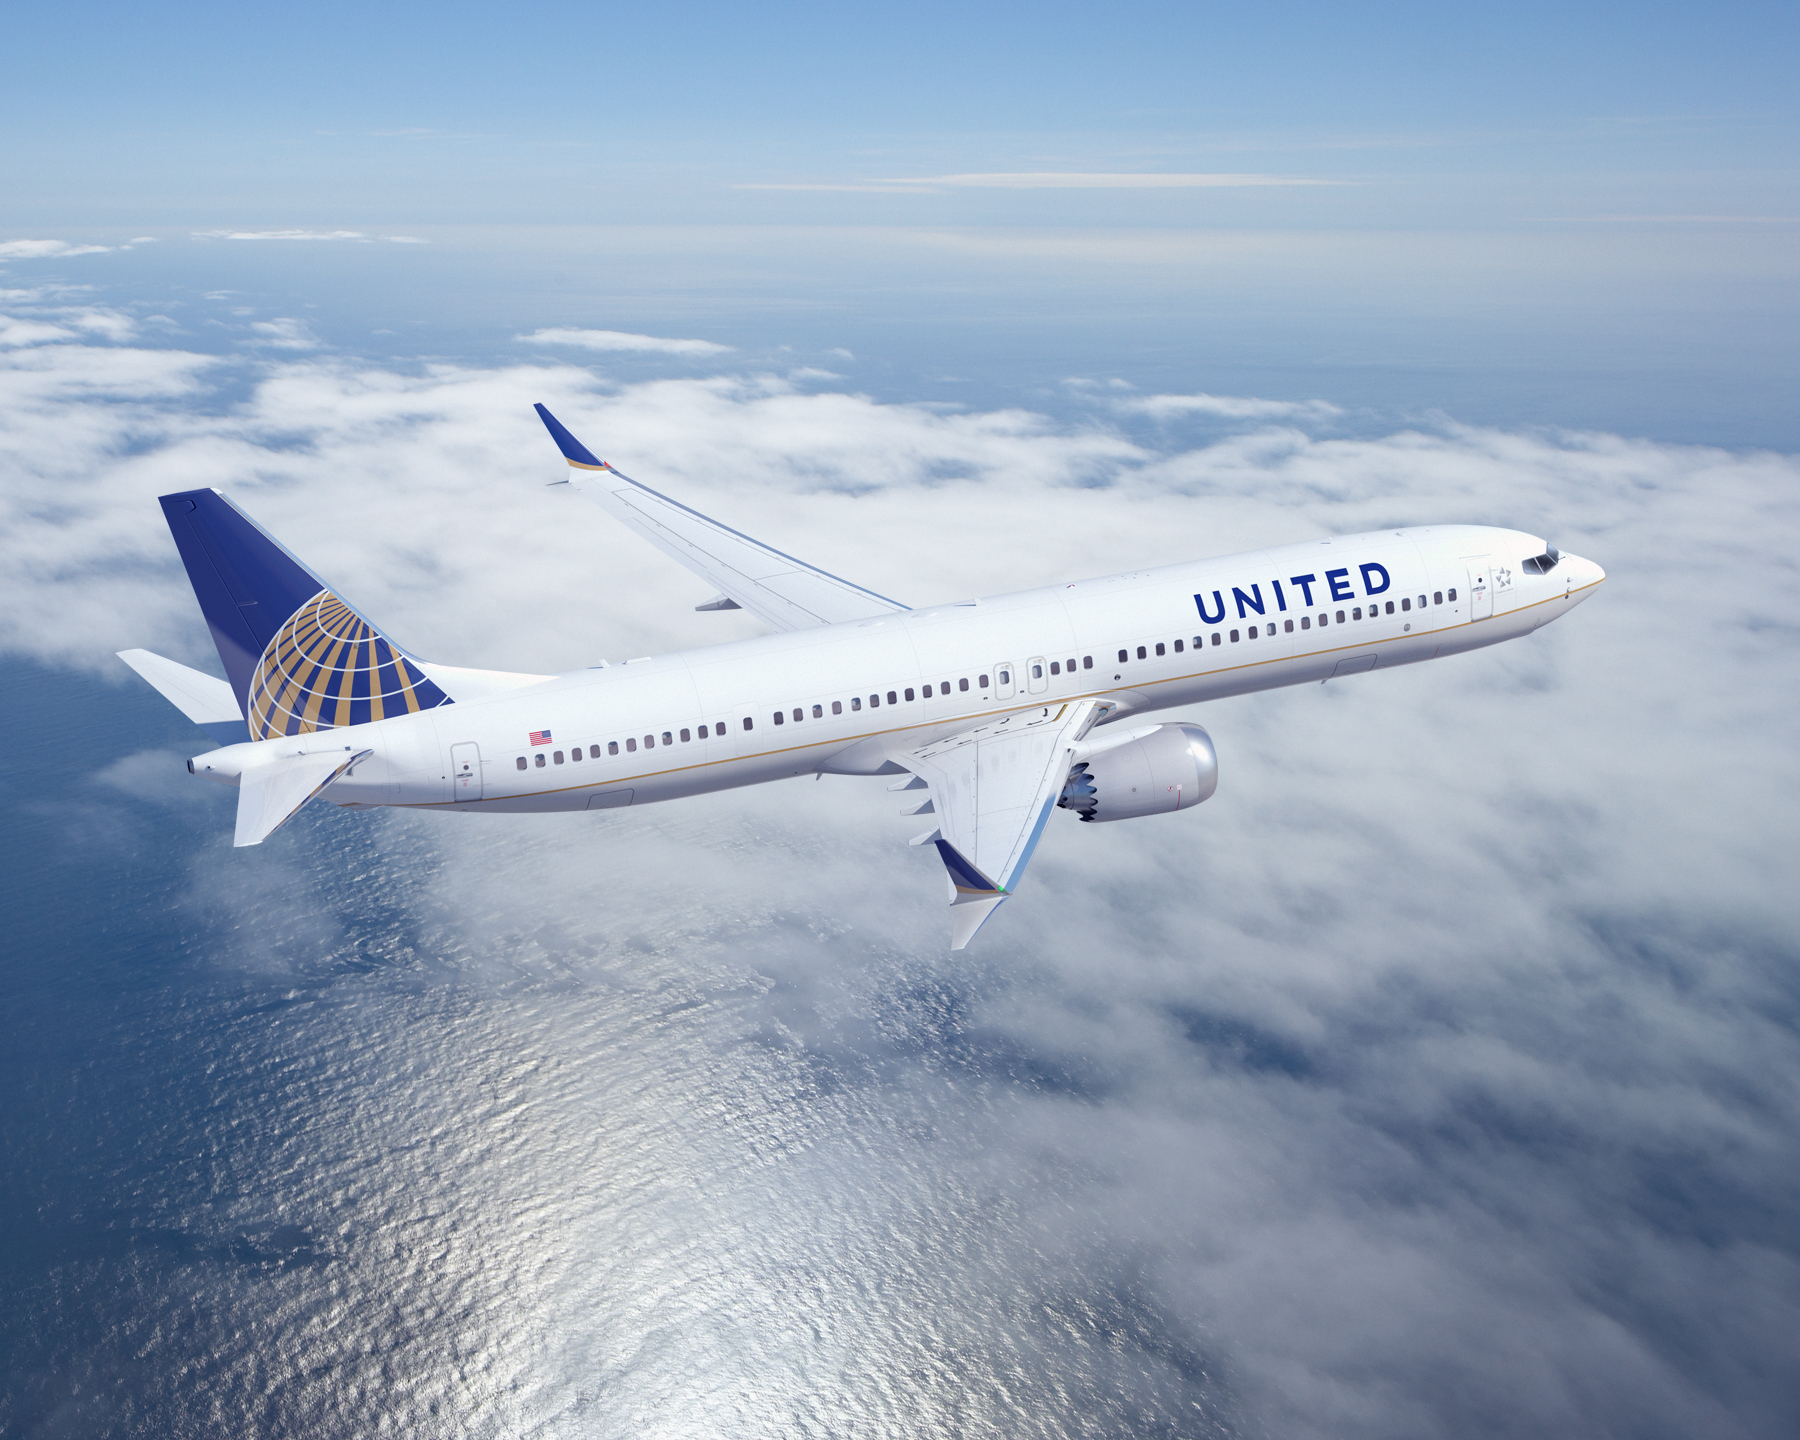
- Became the first North American carrier to operate the fuel efficient Boeing 737 MAX 9 aircraft.
- Opened the new United Polaris lounge at George Bush Intercontinental Airport in Houston, the third of four Polaris lounges expected to open this year.
About United
United Airlines and United Express operate approximately 4,600 flights a day to 357 airports across five continents. In 2017, United and United Express operated more than 1.6 million flights carrying more than 148 million customers. United is proud to have the world’s most comprehensive route network, including U.S. mainland hubs in Chicago, Denver, Houston, Los Angeles, Newark/New York, San Francisco and Washington, D.C. United operates 757 mainline aircraft and the airline’s United Express carriers operate 551 regional aircraft. The airline is a founding member of Star Alliance, which provides service to 193 countries via 28 member airlines. For more information, visit united.com, follow @United on Twitter or connect on Facebook. The common stock of United’s parent, United Continental Holdings, Inc., is traded on the NYSE under the symbol «UAL».
| Preliminary Operational Results | ||||||||
| June | Year-to-Date | |||||||
| 2018 | 2017 | Change | 2018 | 2017 | Change | |||
| REVENUE PASSENGER MILES (000) | ||||||||
| Domestic | 12,402,046 | 11,486,442 | 8.0% | 63,090,862 | 59,337,722 | 6.3% | ||
| Mainline | 10,252,388 | 9,606,457 | 6.7% | 51,344,799 | 48,546,418 | 5.8% | ||
| Regional | 2,149,658 | 1,879,985 | 14.3% | 11,746,063 | 10,791,304 | 8.8% | ||
| International | 9,339,438 | 8,802,176 | 6.1% | 46,702,674 | 44,629,377 | 4.6% | ||
| Atlantic | 4,337,220 | 3,840,347 | 12.9% | 18,188,214 | 16,309,965 | 11.5% | ||
| Pacific | 3,038,212 | 3,020,271 | 0.6% | 16,987,537 | 16,763,543 | 1.3% | ||
| Latin | 1,964,006 | 1,941,558 | 1.2% | 11,526,923 | 11,555,869 | (0.3%) | ||
| Mainline | 1,886,125 | 1,871,725 | 0.8% | 11,074,497 | 11,116,666 | (0.4%) | ||
| Regional | 77,881 | 69,833 | 11.5% | 452,426 | 439,203 | 3.0% | ||
| Consolidated | 21,741,484 | 20,288,618 | 7.2% | 109,793,536 | 103,967,099 | 5.6% | ||
| AVAILABLE SEAT MILES (000) | ||||||||
| Domestic | 13,935,904 | 13,140,909 | 6.0% | 74,100,164 | 69,663,220 | 6.4% | ||
| Mainline | 11,444,210 | 10,900,210 | 5.0% | 59,892,389 | 56,547,402 | 5.9% | ||
| Regional | 2,491,694 | 2,240,699 | 11.2% | 14,207,775 | 13,115,818 | 8.3% | ||
| International | 10,720,097 | 10,523,689 | 1.9% | 58,578,845 | 57,611,511 | 1.7% | ||
| Atlantic | 4,893,280 | 4,691,113 | 4.3% | 23,157,597 | 22,262,483 | 4.0% | ||
| Pacific | 3,534,361 | 3,530,620 | 0.1% | 21,625,592 | 21,279,851 | 1.6% | ||
| Latin | 2,292,456 | 2,301,956 | (0.4%) | 13,795,656 | 14,069,177 | (1.9%) | ||
| Mainline | 2,191,939 | 2,209,517 | (0.8%) | 13,183,048 | 13,437,289 | (1.9%) | ||
| Regional | 100,517 | 92,439 | 8.7% | 612,608 | 631,888 | (3.1%) | ||
| Consolidated | 24,656,001 | 23,664,598 | 4.2% | 132,679,009 | 127,274,731 | 4.2% | ||
| PASSENGER LOAD FACTOR | ||||||||
| Domestic | 89.0% | 87.4% | 1.6 pts | 85.1% | 85.2% | (0.1) pts | ||
| Mainline | 89.6% | 88.1% | 1.5 pts | 85.7% | 85.9% | (0.2) pts | ||
| Regional | 86.3% | 83.9% | 2.4 pts | 82.7% | 82.3% | 0.4 pts | ||
| International | 87.1% | 83.6% | 3.5 pts | 79.7% | 77.5% | 2.2 pts | ||
| Atlantic | 88.6% | 81.9% | 6.7 pts | 78.5% | 73.3% | 5.2 pts | ||
| Pacific | 86.0% | 85.5% | 0.5 pts | 78.6% | 78.8% | (0.2) pts | ||
| Latin | 85.7% | 84.3% | 1.4 pts | 83.6% | 82.1% | 1.5 pts | ||
| Mainline | 86.0% | 84.7% | 1.3 pts | 84.0% | 82.7% | 1.3 pts | ||
| Regional | 77.5% | 75.5% | 2.0 pts | 73.9% | 69.5% | 4.4 pts | ||
| Consolidated | 88.2% | 85.7% | 2.5 pts | 82.8% | 81.7% | 1.1 pts | ||
| ONBOARD PASSENGERS (000) | ||||||||
| Mainline | 10,663 | 10,087 | 5.7% | 54,191 | 51,909 | 4.4% | ||
| Regional | 3,992 | 3,476 | 14.8% | 21,362 | 19,443 | 9.9% | ||
| Consolidated | 14,655 | 13,563 | 8.1% | 75,553 | 71,352 | 5.9% | ||
| CARGO REVENUE TON MILES (000) | ||||||||
| Total | 287,874 | 279,974 | 2.8% | 1,672,216 | 1,575,732 | 6.1% | ||
| OPERATIONAL PERFORMANCE | ||||||||
| Mainline Departure Performance1 | 63.2 | 64.5 | (1.3) | |||||
| Mainline Completion Factor | 99.5 | 99.5 | 0.0 | |||||
| 1 Based on mainline scheduled flights departing by or before scheduled departure time | |
| Note: See Part II, Item 6, Selected Financial Data, of the company’s Annual Report on Form 10-K for the fiscal year ended December 31, 2017 for the definitions of these statistics |


