

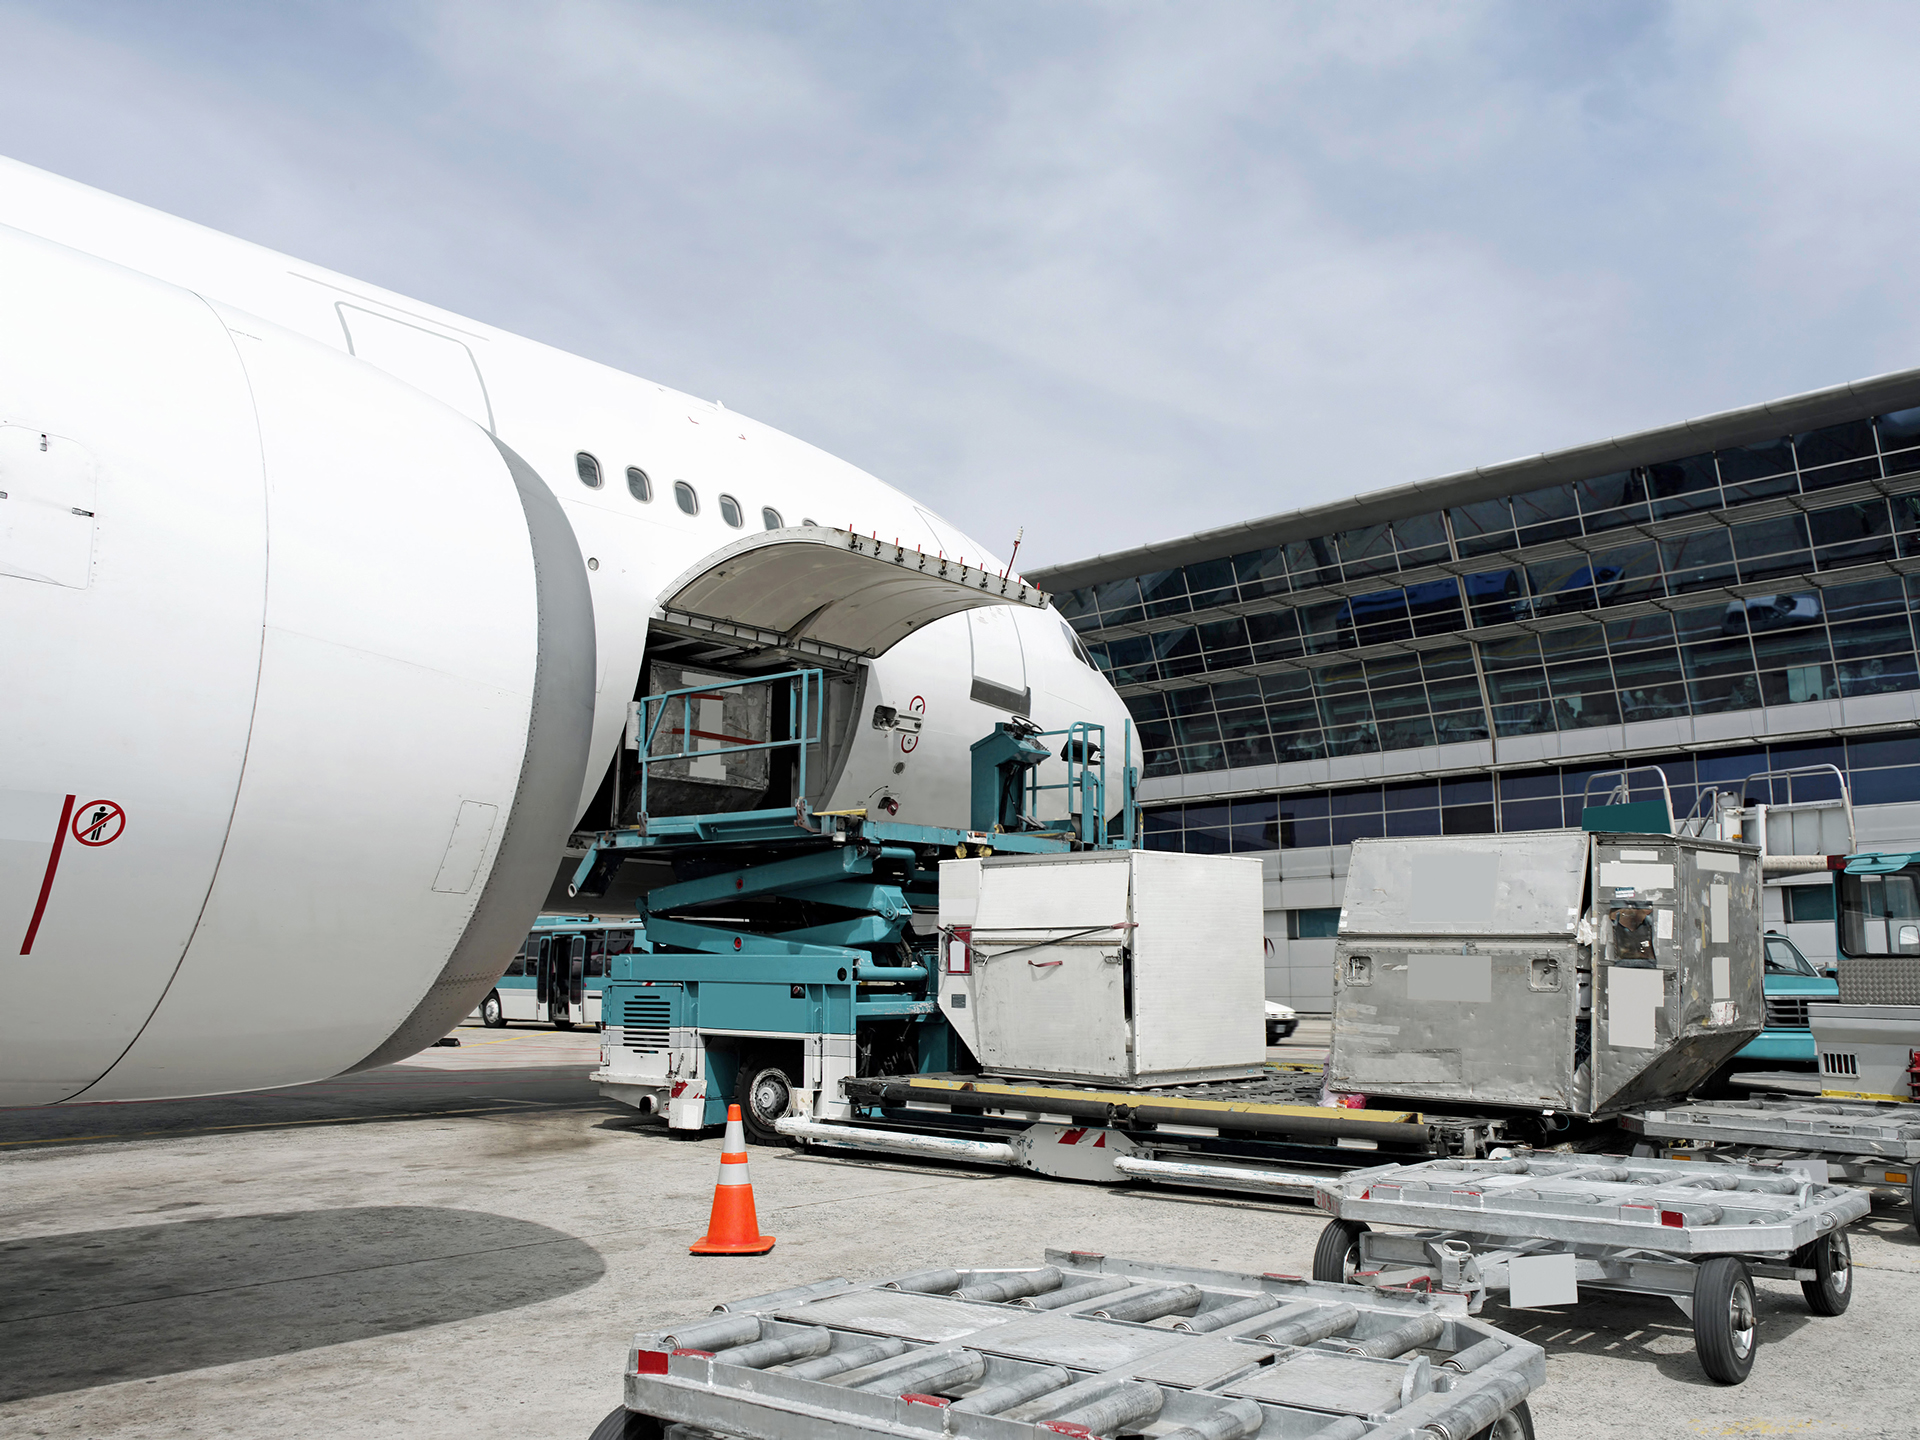
The International Air Transport Association (IATA) released data for April 2026 global air cargo markets showing:
- Total demand, measured in cargo tonne-kilometers (CTK), increased by 4.0% compared to April 2025 levels (+4.0% for international operations).
- Capacity, measured in available cargo tonne-kilometers (ACTK), decreased by -0.4% compared to April 2025 (-0.9% for international operations).
“Air cargo demand grew 4% year-on-year in April, driven by strong Asia-linked trade flows. But this positive news masks a more complex operating environment. Severe disruption at major Gulf hubs due to the war in the Middle East continued to reshape trade routes and constrain capacity on key corridors. With dedicated freighters carrying much of the growth, air cargo is once again keeping supply chains moving amid trade disruptions. The coming months will test how well the sector can absorb continued geopolitical uncertainty and elevated operating costs,” said Willie Walsh, IATA’s Director General.
Several factors in the operating environment should be noted:
- Global trade contracted in March by 2.1% month-on-month after four consecutive months of growth, highlighting the continued vulnerability of trade momentum to geopolitical shocks.
- Jet fuel prices rose sharply in April, up 121.1% year-on-year, alongside a 77.7% increase in crude oil prices.
- Global manufacturing sentiment remained in growth territory in April, strengthening from March. The Purchasing Managers’ Index (PMI) rose 1.9 points to 53.4, while the PMI for new export orders reached 50.2. With both indicators above the 50-point expansion threshold, conditions remain supportive for air cargo demand.
Air Cargo Market in Detail – April 2026
| April 2026 (%year-on-year) | World Share *1 | CTK | ACTK | CLF (%-pt) *2 | CLF (level) *3 |
|---|---|---|---|---|---|
|
Total Market
|
100%
|
4.0%
|
-0.4%
|
1.9
|
46.0%
|
|
Africa
|
2.1%
|
7.7%
|
-9.4%
|
7.8
|
49.1%
|
|
Asia Pacific
|
35.8%
|
10.5%
|
5.3%
|
2.2
|
47.0%
|
|
Europe
|
21.4%
|
6.0%
|
3.0%
|
1.5
|
53.4%
|
|
Latin America and Caribbean
|
2.9%
|
-2.8%
|
1.2%
|
-1.6
|
37.4%
|
|
Middle East
|
13.2%
|
-18.2%
|
-22.9%
|
2.7
|
46.0%
|
|
North America
|
24.6%
|
5.0%
|
1.2%
|
1.5
|
40.9%
|
(*1) % of industry CTK in 2025 (*2) Year-on-year change in load factor (*3) Load factor level
April Regional Performance
Asia-Pacific airlines saw a 10.5% year-on-year growth in air cargo demand in April, the strongest rise of all regions. Capacity increased by 5.3% year-on-year.
North American carriers saw a 5.0% year-on-year increase in air cargo demand in April. Capacity increased by 1.2% year-on-year.
European carriers saw a 6.0% year-on-year increase in demand for air cargo in April. Capacity increased by 3.0% year-on-year.
Middle Eastern carriers saw a -18.2% year-on-year decrease in demand for air cargo in April, the weakest performance of all regions. Capacity decreased by -22.9% year-on-year.
Latin American and Caribbean carriers saw a -2.8% year-on-year decrease in demand for air cargo in April. Capacity increased by 1.2% year-on-year.
African airlines saw a 7.7% year-on-year increase in demand for air cargo in April. Capacity decreased by -9.4% year-on-year.
Trade Lane Growth
Air cargo performance diverged across major trade lanes in April. Africa–Asia led growth followed by Asia–Europe, with intra-Asia also holding strong on regional trade. In contrast, Gulf-linked corridors were severely disrupted by the ongoing conflict in the Middle East.
| Trade Lane | YoY growth | Notes | Market share of industry* |
|---|---|---|---|
|
Africa-Asia
|
+12.8%
|
10 consecutive months of growth
|
1.3%
|
|
Asia-North America
|
+8.3%
|
6 consecutive months of growth
|
23.4%
|
|
Europe-Asia
|
+16.2%
|
38 consecutive months of growth
|
21.5%
|
|
Europe-Middle East
|
-25.9%
|
2 months of contraction
|
5.2%
|
|
Europe-North America
|
-1.0%
|
2 months of contraction
|
13.5%
|
|
Middle East-Asia
|
-22.4%
|
2 months of contraction
|
7.4%
|
|
Within Asia
|
+13.0%
|
30 consecutive months of growth
|
7.3%
|
|
Within Europe
|
+14.0%
|
3 consecutive months of growth
|
1.9%
|
*Share is based on full-year 2025 CTKs.