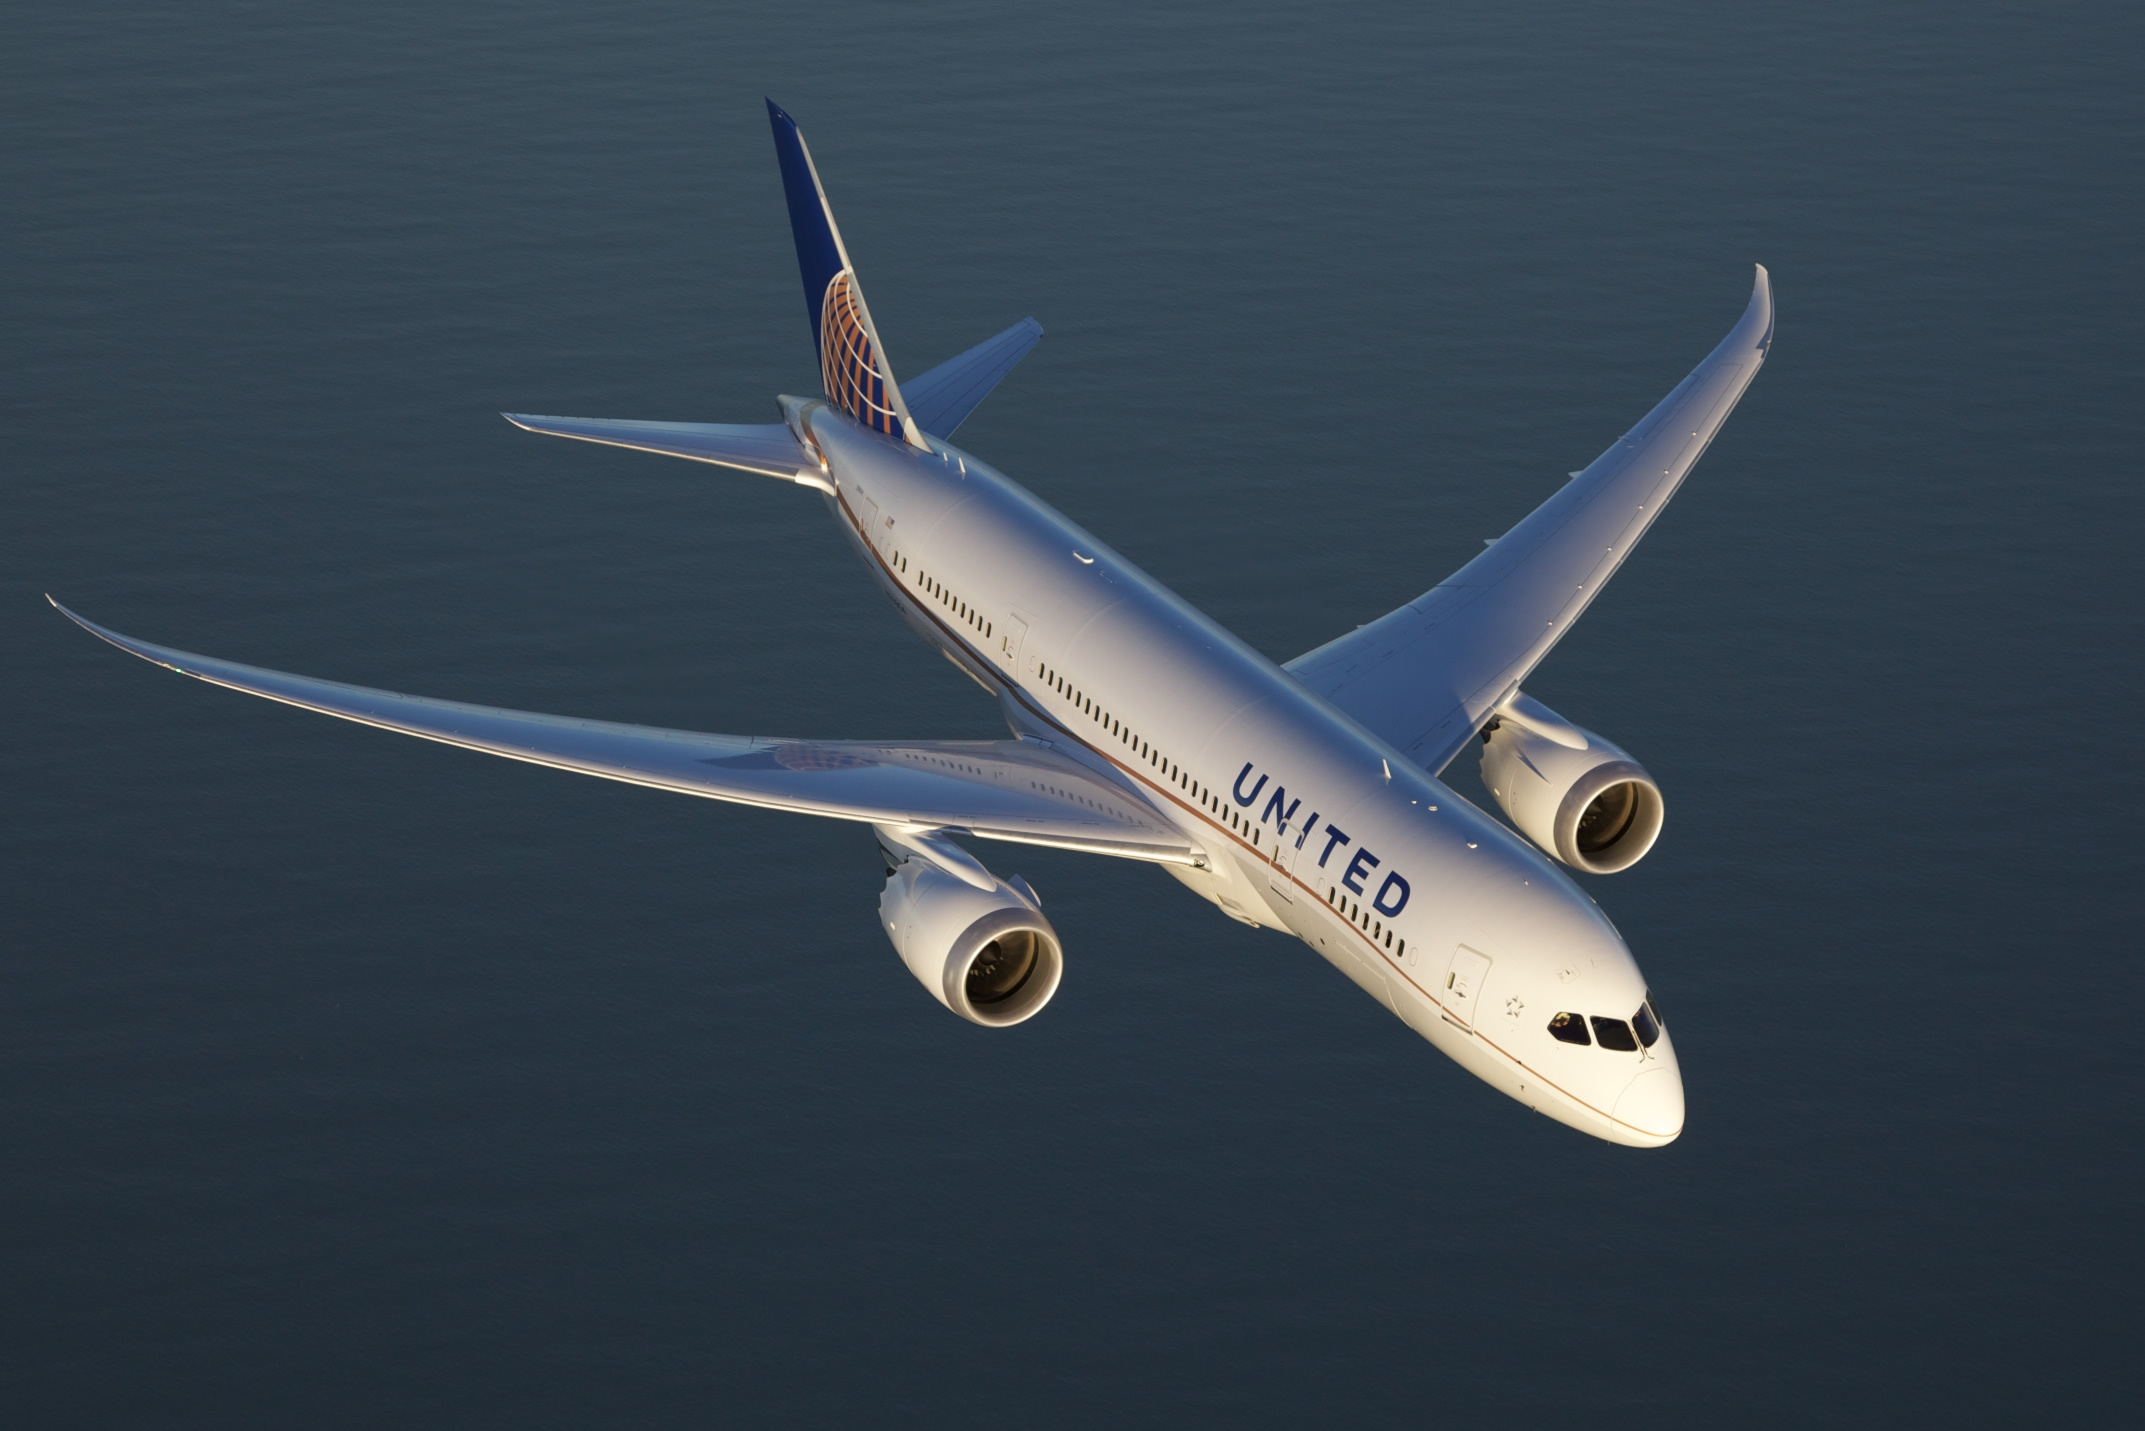
United Airlines (UAL) today reported July 2018 operational results.
UAL’s July 2018 consolidated traffic (revenue passenger miles) increased 6.9 percent and consolidated capacity (available seat miles) increased 4.0 percent versus July 2017. UAL’s July 2018 consolidated load factor increased 2.4 points compared to July 2017.
July Highlights
- Set several company records in the month of July by flying more than 15.4 million customers, having more than 73,000 mainline departures and filling more than 90 percent of total mainline seats.
- Announced orders to purchase 25 new Embraer E-175 and 4 new Boeing 787-9 aircraft.
- As part of a previously announced $8 million commitment, announced a $2 million grant to be split between the Community FoodBank of New Jersey, Urban League of Essex County, and Year Up New York, as well as a $1 million grant to First Place for Youth in Los Angeles.
- Unveiled the redesigned united.com homepage, featuring a more personalized digital experience for each customer and an updated, more modern, user-friendly design.
- Achieved the top score of 100 percent on the 2018 Disability Equality Index (DEI), a prominent benchmarking metric that rates U.S. companies on their disability inclusion policies and practices, also earning UAL a place on DEI’s 2018 «Best Places to Work» list.
- Voted Best Business Class Lounge in the United States by the 2018 World Airline Awards from Skytrax for the Chicago O’Hare United Polaris lounge.
About United
United Airlines and United Express operate approximately 4,600 flights a day to 357 airports across five continents. In 2017, United and United Express operated more than 1.6 million flights carrying more than 148 million customers. United is proud to have the world’s most comprehensive route network, including U.S. mainland hubs in Chicago, Denver, Houston, Los Angeles, Newark/New York, San Francisco and Washington, D.C. United operates 757 mainline aircraft and the airline’s United Express carriers operate 551 regional aircraft. The airline is a founding member of Star Alliance, which provides service to 193 countries via 28 member airlines. For more information, visit united.com, follow @United on Twitter or connect on Facebook. The common stock of United’s parent, United Continental Holdings, Inc., is traded on the NYSE under the symbol «UAL».
|
Preliminary Operational Results |
||||||||
|
July |
Year-to-Date |
|||||||
|
2018 |
2017 |
Change |
2018 |
2017 |
Change |
|||
|
REVENUE PASSENGER MILES (000) |
||||||||
|
Domestic |
13,093,444 |
11,997,825 |
9.1% |
76,184,306 |
71,335,547 |
6.8% |
||
|
Mainline |
10,851,145 |
10,090,634 |
7.5% |
62,195,944 |
58,637,052 |
6.1% |
||
|
Regional |
2,242,299 |
1,907,191 |
17.6% |
13,988,362 |
12,698,495 |
10.2% |
||
|
International |
9,909,733 |
9,515,935 |
4.1% |
56,612,407 |
54,145,312 |
4.6% |
||
|
Atlantic |
4,483,915 |
4,038,394 |
11.0% |
22,672,129 |
20,348,359 |
11.4% |
||
|
Pacific |
3,144,719 |
3,135,175 |
0.3% |
20,132,256 |
19,898,718 |
1.2% |
||
|
Latin |
2,281,099 |
2,342,366 |
(2.6%) |
13,808,022 |
13,898,235 |
(0.6%) |
||
|
Mainline |
2,192,591 |
2,258,147 |
(2.9%) |
13,267,088 |
13,374,813 |
(0.8%) |
||
|
Regional |
88,508 |
84,219 |
5.1% |
540,934 |
523,422 |
3.3% |
||
|
Consolidated |
23,003,177 |
21,513,760 |
6.9% |
132,796,713 |
125,480,859 |
5.8% |
||
|
AVAILABLE SEAT MILES (000) |
||||||||
|
Domestic |
14,474,602 |
13,651,010 |
6.0% |
88,574,766 |
83,314,230 |
6.3% |
||
|
Mainline |
11,898,478 |
11,355,336 |
4.8% |
71,790,867 |
67,902,738 |
5.7% |
||
|
Regional |
2,576,124 |
2,295,674 |
12.2% |
16,783,899 |
15,411,492 |
8.9% |
||
|
International |
11,284,307 |
11,114,243 |
1.5% |
69,863,152 |
68,725,754 |
1.7% |
||
|
Atlantic |
5,108,634 |
4,865,154 |
5.0% |
28,266,231 |
27,127,637 |
4.2% |
||
|
Pacific |
3,631,892 |
3,662,096 |
(0.8%) |
25,257,484 |
24,941,947 |
1.3% |
||
|
Latin |
2,543,781 |
2,586,993 |
(1.7%) |
16,339,437 |
16,656,170 |
(1.9%) |
||
|
Mainline |
2,441,401 |
2,492,076 |
(2.0%) |
15,624,449 |
15,929,365 |
(1.9%) |
||
|
Regional |
102,380 |
94,917 |
7.9% |
714,988 |
726,805 |
(1.6%) |
||
|
Consolidated |
25,758,909 |
24,765,253 |
4.0% |
158,437,918 |
152,039,984 |
4.2% |
||
|
PASSENGER LOAD FACTOR |
||||||||
|
Domestic |
90.5% |
87.9% |
2.6 pts |
86.0% |
85.6% |
0.4 pts |
||
|
Mainline |
91.2% |
88.9% |
2.3 pts |
86.6% |
86.4% |
0.2 pts |
||
|
Regional |
87.0% |
83.1% |
3.9 pts |
83.3% |
82.4% |
0.9 pts |
||
|
International |
87.8% |
85.6% |
2.2 pts |
81.0% |
78.8% |
2.2 pts |
||
|
Atlantic |
87.8% |
83.0% |
4.8 pts |
80.2% |
75.0% |
5.2 pts |
||
|
Pacific |
86.6% |
85.6% |
1.0 pt |
79.7% |
79.8% |
(0.1) pts |
||
|
Latin |
89.7% |
90.5% |
(0.8) pts |
84.5% |
83.4% |
1.1 pts |
||
|
Mainline |
89.8% |
90.6% |
(0.8) pts |
84.9% |
84.0% |
0.9 pts |
||
|
Regional |
86.5% |
88.7% |
(2.2) pts |
75.7% |
72.0% |
3.7 pts |
||
|
Consolidated |
89.3% |
86.9% |
2.4 pts |
83.8% |
82.5% |
1.3 pts |
||
|
ONBOARD PASSENGERS (000) |
||||||||
|
Mainline |
11,309 |
10,650 |
6.2% |
65,500 |
62,559 |
4.7% |
||
|
Regional |
4,111 |
3,542 |
16.1% |
25,473 |
22,985 |
10.8% |
||
|
Consolidated |
15,420 |
14,192 |
8.7% |
90,973 |
85,544 |
6.3% |
||
|
CARGO REVENUE TON MILES (000) |
||||||||
|
Total |
293,576 |
278,743 |
5.3% |
1,965,792 |
1,854,475 |
6.0% |
||
|
OPERATIONAL PERFORMANCE |
||||||||
|
Mainline Departure Performance 1 |
62.3% |
63.3% |
(1.0) pt |
|||||
|
Mainline Completion Factor |
99.3% |
99.3% |
0.0 pts |
|||||
|
1Based on mainline scheduled flights departing by or before scheduled departure time |


